



This year’s report is particularly noteworthy as it captures the initial impact of the Community Pharmacy Agreement 2025 (CPA25), representing the first annual report following its introduction. The report therefore provides an early indication of how the overdue adjustment to pharmacy remuneration is influencing pharmacy activity, reimbursement patterns and service delivery. As the most significant reform of community pharmacy funding in recent years, the Agreement represented an important step towards addressing the erosion in the real value of pharmacy remuneration following 17 years without a substantive adjustment, helping to recognise rising service delivery costs, strengthen sector sustainability and support the continued expansion of pharmacists’ clinical and patient care role.
As can be seen in Table 1, the proportion of the population eligible for the General Medical Services (GMS) Scheme continued to decline gradually in 2025, falling to 28.44%.
The most notable increase was observed within the Drugs Payment Scheme (DPS), where the number of persons for whom claims were submitted to the PCRS by pharmacies rose from 603,959 in 2024 to 774,351 in 2025, representing a 28% increase, driven largely by the introduction of the Hormone Replacement Therapy (HRT) Arrangement. This continues the increases seen over previous years driven by successive reductions in DPS threshold from 2018 to 2022.
Eligibility under the Long-Term Illness (LTI) Scheme also continued its upward trajectory, increasing from 185,903 individuals (3.78% of the population) in 2019 to 233,023 (4.27%) in 2025. While more modest in scale, this growth reflects an increasing number of patients requiring long-term treatment for chronic conditions covered under the Scheme.
Collectively, these trends point to a gradual shift in the composition of State-supported medicines coverage. Although the GMS Scheme remains the dominant reimbursement mechanism, the continued growth in DPS and LTI participation highlights the increasing role of alternative schemes in meeting patient need. This evolving eligibility profile has important implications for future expenditure, prescribing patterns and the delivery of pharmaceutical care within the community pharmacy setting.
Table 1: Number of eligible persons| Year | GMS eligibility | DPS utilisation | LTI eligibility | |||
| Number of persons | % of population | Number of persons* | % of population | Number of persons* | % of population | |
| 2019 | 1,544,374 | 31.38% | 273,594 | 5.56% | 185,903 | 3.78% |
| 2020 | 1,584,790 | 31.84% | 280,703 | 5.64% | 190,829 | 3.83% |
| 2021 | 1,545,222 | 30.83% | 308,665 | 6.16% | 195,064 | 3.89% |
| 2022 | 1,568,379 | 30.46% | 445,725 | 8.66% | 202,558 | 3.93% |
| 2023 | 1,611,187 | 30.51% | 526,619 | 9.97% | 212,973 | 4.03% |
| 2024 | 1,561,730 | 29.03% | 603,959 | 11.23% | 223,000 | 4.14% |
| 2025 | 1,552,553 | 28.44% | 774,351 | 14.19% | 233,023 | 4.27% |
Source: PCRS Annual Reports
*The DPS and LTI figures shown refer to the number of eligible patients for whom claims were submitted to the PCRS by pharmacies.
Ireland continues to experience sustained population growth, with demand for healthcare services increasing year on year. In contrast, growth in the number of pharmacies has remained limited, resulting in a steadily rising number of people relying on each pharmacy for provision of medicines and healthcare services. As shown in Table 2, the average population served per pharmacy had increased to 2,843 by 2025, highlighting the growing demand being placed on a largely static pharmacy network.
Table 2: Number of HSE pharmacy contractors and patients per pharmacy
| Year | Number of HSE pharmacy contractors | Year-on- year change | CSO National Population | Patients per Pharmacy | % change since 2019 | |
| 2019 | 1,884 | – | 4,921,500 | 2,612 | – | |
| 2020 | 1,900 | +16 | 4,977,400 | 2,620 | 0.3% | |
| 2021 | 1,915 | +15 | 5,011,500 |
|
0.2% | |
| 2022 | 1,915 | 0 | 5,149,139 |
|
2.9% | |
| 2023 | 1,911 | -4 | 5,281,600 |
|
5.8% | |
| 2024 | 1,912 | +1 | 5,380,300 |
|
7.7% | |
| 2025 | 1,920 | +8 | 5,458,600 | 2,843 | 8.8% |
Sources: PCRS Annual Reports, CSO
Against this backdrop, community pharmacies have continued to absorb increasing workload pressures, rising operating costs and expanding service delivery requirements, while playing an ever more significant role in the delivery of accessible primary care.
Community pharmacy is now an established component of Ireland’s primary care infrastructure and, as the most accessible healthcare provider, is an increasingly important partner in achieving the Government’s Sláintecare ambitions of supporting people to access care as close to their home as possible.
The number of items reimbursed by the PCRS continued its upward trajectory in 2025, exceeding 110.1 million items, representing a 5.2% increase compared to 2024 (see Table 3). This translates into an average of 57,347 items reimbursed per pharmacy in 2025, compared with 54,750 in 2024.
Table 3: Number of items reimbursed by the PCRS
| Year | No. of items reimbursed (excl. vaccinations) | No. of pharmacies with HSE Contracts | Average number of items reimbursed annually per pharmacy |
| 2019 | 79,201,607 | 1,884 | 42,039 |
| 2020 | 81,156,526 | 1,900 | 42,714 |
| 2021 | 84,145,647 | 1,915 | 43,940 |
| 2022 | 91,237,003 | 1,915 | 47,643 |
| 2023 | 98,111,761 | 1,911 | 51,341 |
| 2024 | 104,681,309 | 1,912 | 54,750 |
| 2025 | 110,106,425 | 1,920 | 57,347 |
The number of items reimbursed by the PCRS has increased by 39% since 2019. Some of this growth is as a result of the transfer of private dispensing activity to state-funded due to policy decisions such as the various reductions in the DPS threshold from 2018 to 2022, the introduction of the Free Contraception Scheme in September 2022 and subsequent expansions of the age cohorts covered up until July 2024, and the introduction of the Hormone Replacement Therapy (HRT) Arrangement in June 2025. However, there has also been substantial underlying growth in dispensing activity driven by population growth, demographic ageing, and the increasing complexity of medication regimens.
Total Community Drug Scheme (CDS) fees (excluding the High-Tech Arrangement and vaccination fees) increased to €498.6 million in 2025, up from €457.7 million in 2024, a €40.9 million increase (see Table 4).
In 2025, the average CDS fee payment per pharmacy increased to €259,688, representing an 8.5% increase on the 2024 figure of €239,362. This marks the largest year-on-year increase observed since 2019.
Table 4: Average PCRS fee payments to pharmacies
| Year | Total CDS fees (excl. High-Tech and vaccination) | Number of pharmacy contracts | Average CDS fees per pharmacy (excl. High-Tech and vaccination) |
| 2019 | €374.29m | 1,884 | €198,668 |
| 2020 | €372.88m | 1,900 | €196,253 |
| 2021 | €381.71m | 1,915 | €199,326 |
| 2022 | €407.02m | 1,915 | €212,543 |
| 2023 | €433.06m | 1,911 | €226,614 |
| 2024 | €457.66m | 1,912 | €239,362 |
| 2025 | €498.60m | 1,920 | €259,688 |
Source: PCRS Annual Reports
Total CDS fees increased by 8.9% in 2025, outpacing the 5.2% growth in reimbursed items. This stronger growth in fees reflects the initial impact of the revised tiered dispensing fee structure introduced under CPA25 from September 2025. It will be 2026 before the full effect will be seen.
When High-Tech patient care fees and immunisation service fees are excluded, the average core CDS dispensing fee per item increased from €4.42 in 2024 to €4.58 in 2025, as can be seen in Table 5. This demonstrates the effect of the increase in the tiered fees under the CPA25 from September 2025. Notably, the average fee rose despite continued growth in CDS dispensing volumes, which would ordinarily be expected to reduce the average fee per item due to the tiered fee structure.
Table 5: Average CDS dispensing fee per item
| Year | Total core dispensing fees (excl. High-Tech and vaccination) | No. of items reimbursed under CDS (excl. High-Tech and vaccination) | Average CDS dispensing fee per item (excl. High-Tech and vaccination) | Year-on- year change |
| 2019 | €374.29m | 78,314,344 | €4.78 | – |
| 2020 | €372.88m | 80,358,089 | €4.64 | -2.9% |
| 2021 | €381.71m | 83,278,178 | €4.58 | -1.3% |
| 2022 | €407.02m | 90,291,519 | €4.51 | -1.5% |
| 2023 | €433.06m | 97,075,326 | €4.46 | -1.1% |
| 2024 | €457.66m | 103,546,827 | €4.42 | -0.9% |
| 2025 | €498.60m | 108,871,793 | €4.58 | +3.6% |
Source: PCRS Annual Reports
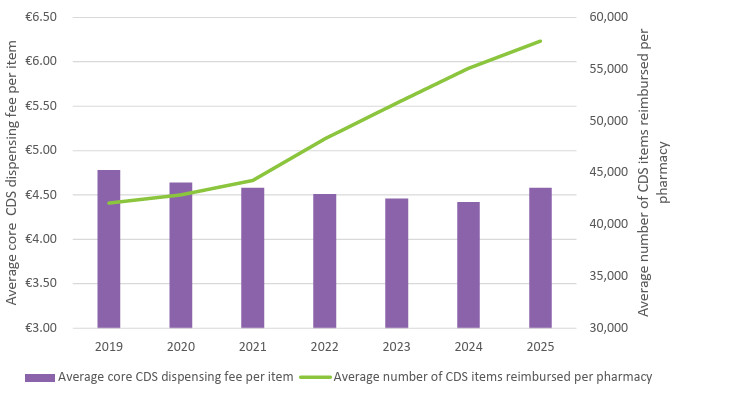
Figure 1 illustrates the long-term relationship between dispensing volumes and the average core CDS dispensing fee. While CDS reimbursement volumes have increased consistently, the average core dispensing fee per item declined steadily for a number of years, resulting in a widening gap between workload and associated cost of service provision, and remuneration.
The increase in the average core dispensing fee to €4.58 per item in 2025, despite the revised fee structure applying only for the final four months of 2025, represents a welcome reversal of this trend. The increase represents the first improvement in average remuneration per item in several years and provides an early indication of the impact of the overdue adjustment to pharmacy remuneration provided for under the CPA25 funding framework.
Figure 1: Average core CDS dispensing fee versus average number of CDS items per pharmacy
Source: PCRS Annual Reports
| CDS/service | Number of items claimed from PCRS in 2024 | Number of items claimed from PCRS in 2025 | Percentage change year-on-year |
| GMS Scheme | 71,305,221 | 72,529,280 | +1.7% |
| DPS | 18,759,651 | 22,169,157 | +18.2% |
| LTI Scheme | 11,692,951 | 12,266,062 | +4.9% |
| High-Tech Arrangement | 1,134,482 | 1,234,632 | +8.8% |
| Free Contraception Scheme | 1,015,168 | 1,121,611 | +10.5% |
| Influenza vaccinations | 373,298 | 504,173 | +35.1% |
| Opioid Substitution Treatment Scheme | 351,647 | 337,520 | -4.0% |
| Discretionary Hardship Arrangements | 183,407 | 206,102 | +12.4% |
| COVID-19 vaccinations | 235,938 | 201,742 | -14.5% |
| Dental Treatment Services Scheme | 107,223 | 110,036 | +2.6% |
| Health (Amendment) Act | 102,105 | 104,758 | +2.6% |
| EEA Scheme | 29,454 | 27,267 | -7.4% |
| Total | 105,290,545 | 110,812,340 | +5.2% |
Source: PCRS Annual Reports
The number of items claimed under the GMS Scheme continues to grow despite the continued decrease in the proportion of patients with this eligibility. Even though GMS eligibility only covers 28% of the population, GMS claims accounted for approximately 65% of all items reimbursed by the PCRS.
Part of the growth in the number of items reimbursed by the PCRS between 2024 and 2025 is due to the increase in DPS dispensing volumes by 18% in that period, equivalent to approximately 3.4 million additional items. A significant proportion of this increase is attributable to the introduction of the Hormone Replacement Therapy (HRT) Arrangement in June 2025. While these items are now recorded within DPS activity, they mostly reflect prescriptions that were already being dispensed by community pharmacies prior to the introduction of the arrangement. Consequently, most of the increase due to the HRT Arrangement represents a transfer of existing private business into a State-funded arrangement due to policy decisions rather than the generation of new dispensing activity or additional revenue for pharmacies.
After experiencing rapid growth following its introduction and the successive expansion of eligible age cohorts, the number of items claimed under the Free Contraception Scheme increased by 10% between 2024 and 2025, compared with growth of 37% between 2023 and 2024, indicating a gradual moderation in the rate of expansion.
The number of items reimbursed under the Discretionary Hardship Arrangement increased from 183,407 in 2024 to 206,102 in 2025, representing year-on-year growth of 12.4%. Over a longer period, reimbursed items increased from 140,752 in 2019, an overall rise of 46.4%. This growth has been driven in part by the increasing prevalence of medicines shortages, which have necessitated greater use of Exempt Medicinal Products (EMPs) to maintain continuity of patient care. Where an EMP does not have a GMS administrative code, reimbursement claims for GMS patients must be processed through the Discretionary Hardship Arrangement, contributing to the sustained increase in activity under this scheme.
Expenditure under the arrangement increased from €14.53 million in 2024 to €15.71 million in 2025, reflecting both the increase in claim volumes and the high-cost nature of medicines supplied through the arrangement.
The average cost per item under the Discretionary Hardship Arrangement was €76.22 in 2025. Although this is a slight drop from €79.22 in 2024, it is still substantially higher than that observed across other CDS, standing at more than twice the LTI average, and over four times the GMS and DPS averages (see Table 6).
Table 6: Average cost per item
| Scheme/Arrangement | Average cost per item |
| GMS Scheme | €15.62 |
| DPS | €18.43 |
| LTI Scheme | €32.50 |
| Discretionary Hardship Arrangement | €76.22 |
Source: PCRS Annual Reports
While the arrangement accounts for only a small proportion of overall PCRS-reimbursed items, it continues to present challenges associated with the process of applying for approval, manual claiming through Local Health Offices and delays in payment in certain areas. A key next step for the arrangement is the planned centralisation of its administration to the PCRS, which is intended to streamline applications, allow for electronic claiming, and bring payment schedules into line with other electronically claimed schemes.
The High-Tech Arrangement continues to be a major driver of growth in medicines expenditure by the State, reflecting both increased patient access to specialist therapies and the continued expansion of the medicines covered under the scheme. Since 2019, the number of patients receiving High-Tech medicines has increased by 63%, while dispensing volumes have grown by 66% to 1.2 million items in 2025, demonstrating the increasing importance of the arrangement in supporting the delivery of complex therapies through community pharmacy. High-Tech Patient Care Fee payments to community pharmacies have continued to grow in-line with increasing dispensing volumes, rising from €25.84 million in 2019 to €50.11 million in 2024 and €53.89 million in 2025.
The growth in dispensing volumes has been accompanied by a substantial increase in expenditure by the State on High-Tech medicines supplied through wholesalers and manufacturers, which reached €1.30 billion in 2025, compared with €849 million in 2019. Antineoplastic and immunomodulating agents continue to account for the majority of expenditure, representing approximately three-quarters of total High-Tech spend.
The continued expansion of the High-Tech Arrangement demonstrates its strategic importance in facilitating equitable patient access to innovative therapies while also representing one of the most significant drivers of medicines expenditure growth within the health service. While High-Tech expenditure continues to increase, community pharmacies remain central to the delivery of these therapies, enabling patients to access specialist medicines locally while reducing reliance on hospital pharmacy services.
Community pharmacies continue to play an integral role in the delivery of public health services, particularly vaccination programmes. Public confidence in pharmacy-based vaccination remains high, with the IPSOS B&A Pharmacy Usage and Attitudes Survey 2025 reporting that almost nine in ten people are comfortable receiving vaccinations in a pharmacy.
PCRS payments for pharmacy vaccination services increased to €21.65 million in 2025, driven by significant growth in influenza vaccination activity in 2025, which increased by 35% compared to 2024 and 84% compared to 2023. This is due to the strong involvement of community pharmacies in the LAIV schools programme, with more than 56% of all children’s LAIV vaccinations being administered by community pharmacists in the Seasonal Influenza Programme 2025/2026. Demand for COVID-19 vaccination services continued to decrease, however.
The trend in influenza vaccination reflects the continued integration of community pharmacy into national prevention and population health strategies, reinforcing its role as a scalable and accessible vaccination platform. This role continues to evolve, with pharmacists now authorised and funded to administer the pneumococcal polysaccharide vaccine (PPV23) to healthy over 65-year-olds who hold a GMS Card, GP Visit Card (GPVC) or Health Amendment Act (HAA) Card as part of the national immunisation programme from 1 May 2026, further broadening the range of vaccination services available through community pharmacy.
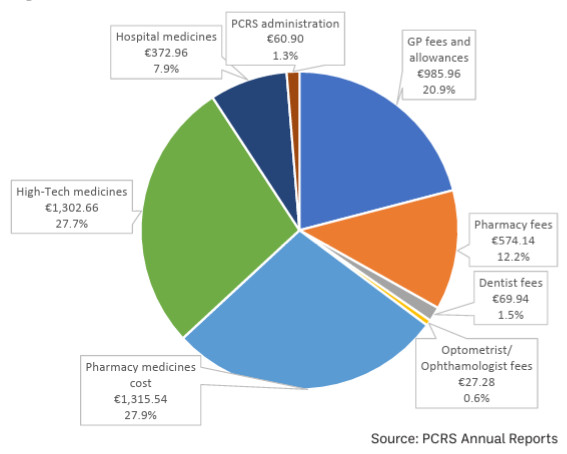
Total PCRS payments and reimbursements during 2025 amounted to approximately €4.71 billion, an increase of €309 million on 2024. This growth was driven largely by rising medicines expenditure across the Community Drug Schemes, High-Tech medicines and centrally reimbursed hospital medicines. A breakdown of PCRS expenditure is shown in Figure 3.
Figure 3: PCRS payments and reimbursements
 Source: PCRS Annual Report 2025
The PCRS Annual Report 2025 illustrates the growing reliance of the health service on community pharmacy to deliver accessible medicines and an expanding range of patient services. Across virtually every measure, including patient numbers, prescription volumes, vaccination activity, High-Tech medicines and community scheme utilisation, demand continues to increase.
CPA25 represents an important first step in addressing the long-standing erosion in the real value of pharmacy remuneration, while also recognising the evolving role of community pharmacy and the increasing costs of service provision. Although the adjustment to dispensing fees only took effect in September, its impact can already be seen. However, the trends set out in this report also make clear that future policy and funding decisions must ensure the pharmacy network has the capacity, resources and investment needed if pharmacies are to continue supporting access, prevention and the wider transformation of healthcare delivery in Ireland.
For more information, please contact the IPU Contract Unit at contract@ipu.ie.
This article is based on the PCRS Statistical Analysis of Claims and Payments Annual Report 2025, and all data and insights are drawn from the report. The report is available at sspcrs.ie/portal/annual-reporting > PCRS Annual Reports.