Home » PCRS Annual Report 2023
The PCRS released its Annual Report 2023 in October, offering valuable insights for pharmacists into the reimbursement trends of the Community Drug Scheme. This Report is a helpful resource for pharmacies to analyse and compare their performance, as well as to understand developments in the wider healthcare sector. In this article Zrinka Bulj and Ciaran Mulligan from the Contracts Department discuss the key findings of the latest report.

The number of HSE Pharmacy Contractors stood at 1,911 in 2023 (see Table 1). For the first time, there were more pharmacy closures than new openings in 2023. This resulted in a slight decrease in the number of pharmacies compared to 2022, indicating a potential shift and emerging trend in the sector. This reflects the inflationary pressures on the sector after a 16-year dispensary remuneration pay freeze. Addressing the funding challenges by reinvestment in the community pharmacy sector could help prevent the significant number of closures anticipated in the coming years, particularly among small pharmacies in rural areas.
Table 1: Pharmacy contractors
 Source: Annual PCRS reports.
The practice of pharmacy is becoming increasingly pressured, driven by the increasing volume and complexity of medicine management. The volume of items dispensed under the Community Drug Schemes (CDS) continues to rise steadily with nearly 100 million items dispensed in 2023 (see Table 2). This is in part due to the continuing rise in both population and in the number of eligible patients. On average, each pharmacy dispenses over 4,300 items per month on the CDS, which adds up to 51,724 items per year per pharmacy on average. The total number of items dispensed under the CDS in 2023 has increased by 45.7 per cent compared to 2009 (from circa 68 million to circa 99 million). However, the average number of items dispensed per pharmacy has only increased by 24.3 per cent over this period due to the increased number of pharmacies in the country.
Table 2: Number of items dispensed under Community Drug Schemes
 Source: Annual PCRS reports (excluding private).
Last year, the average CDS fees per pharmacy increased minimally by 4 per cent, driven by the higher volume of items dispensed (which increased 7 per cent year-on-year). However, compared to 2009, the number of dispensed items has grown by 25 per cent, but the average fees paid per pharmacy are less than in 2009 as a result of the sliding fee scale (see Table 3).
Table 3: Average fee payments to pharmacies
 Source. Annual PCRS Reports.
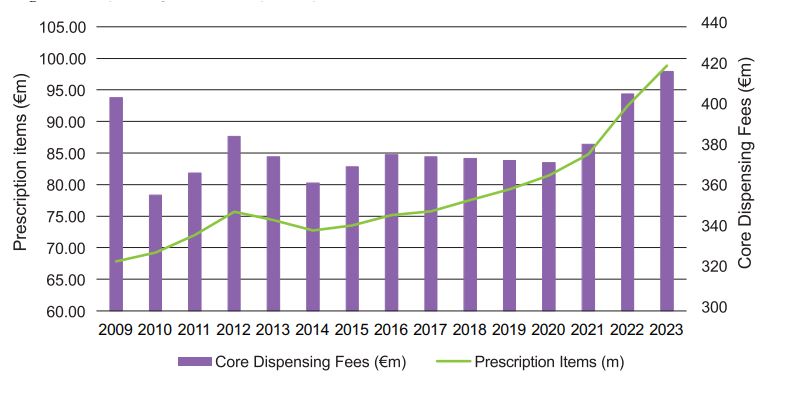
Total dispensing fees for the pharmacy sector have now exceeded the 2009 figures, driven by the increased volume of items dispensed (see Figure 1).
Figure 1: Dispensing fees verses prescription items

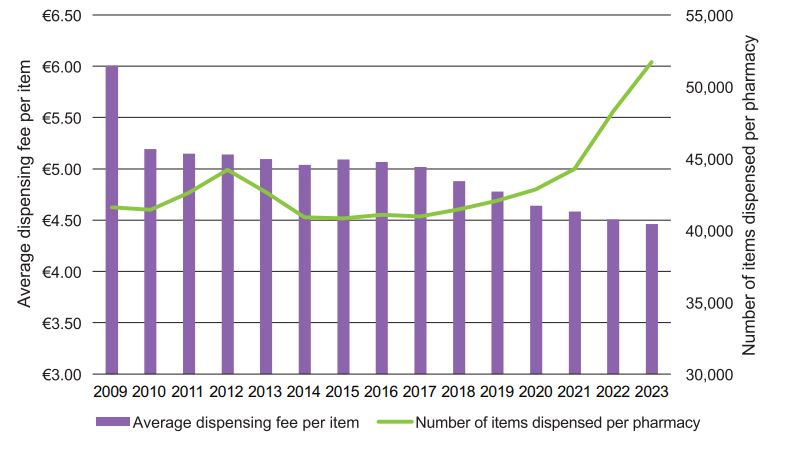
When we exclude the High-Tech Scheme and vaccination administration from the figures to give us a measure of the fees for our core role, which is the safe supply and counselling of medication, we see that the average core dispensing fee per item continues to decline from a high of €6.00 per item in 2009 to €4.46 in 2023 (see Table 4). This represents a 25.7 per cent decline in the average fee per item over the period, at a time when wage costs have increased by 33 per cent since 2009 and other overheads have increased significantly (see IPU White Paper, Key Enablers for a Sustainable Pharmacy Model published in July 2024 and IPU Pre-Budget Submission 2025). This inflationary pressure, coupled with a declining average fee per item, will be unsustainable going forward.
Table 4: Average dispensing fee per item Source. Annual PCRS Reports.
In Figure 2 we can see that as the average number of items dispensed per pharmacy continues to increase, the core average dispensing fee per item decreases due to the regressive fee structure. This is why it feels pressurised to work in community pharmacy at the moment and shows the importance of addressing our pay claim.
Figure 2: Average fee versus number of items


“[There has been] a 25.7 per cent decline in the average fee per item over the period, at a time when wage costs have increased by 33 per cent since 2009 and other overheads have increased significantly.”Table 5: PCRS payments to pharmacy and GP contractors
 Source. Annual PCRS Reports.
g
The PCRS Annual Reports provide for a valuable opportunity to assess reimbursement trends of the Community Drug Scheme. This is particularly pertinent at present given the ongoing pay talks. The statistics provided by the PCRS Unit within the HSE reinforce what the IPU continuously hears from our members — the current situation is unsustainable because, as evidenced in the Report, the average fee per item continues to decline, while inflationary pressures continue to rise.
If you have further questions on this Report, or need support from the IPU’s Contract Unit, please contact us on contract@ipu.ie.

Ciaran Mulligan MPSI, Interim Contracts Manager, IPU
and Zrinka Bulj, Claims Analyst, IPU
Highlighted Articles